Enabling CLAS Healthcare to efficiently generate reports and derive trends from their data
For CLAS Healthcare’s marketing team, generating reports to show results to contracted doctors involved manual analysis in Excel sheets which was very time consuming. CLAS Healthcare teamed up with Microsoft to turn their data into visuals that help to demonstrate tangible results to their contracted doctors and provide deeper insight into market trends. CLAS Healthcare integrated interactive dashboards into their admin portal using Power BI Embedded, allowing the marketing team to spend less time doing manual analysis in Excel sheets more effective in helping them understand their data and generate market strategies for the future.
Key technologies used
- Power BI Embedded
- Power BI Desktop
- Azure SQL Database
- Azure App Service (web app)
- Microsoft .NET Framework (for report deployment and viewing)
Core Team
From CLAS Healthcare
- Ms. Ha Nguyen, Chief Marketing Officer
- Mr. Long Nguyen, Software Developer
- Dr. Loan Nguyen
From Microsoft
- Mr. Frank Nguyen, Senior Technical Evangelist
- Mr. Toan Huynh, Senior Technical Evangelist
Customer profile
CLAS Healthcare JSC, http://clashealthcare.vn/en
CLAS Healthcare is a founding member of Microsoft Health Innovation Lab Vietnam, formed in partnership with the APAC PS Health team. CLAS Healthcare combines its own solutions with those of regional/global ISVs entering Vietnam to deliver individual or end-to-end solutions for engaging patients, empowring care teams, optimizing clinical/operational effectiveness, and transforming services like Family Doctor Service. CLAS Healthcare aims to be the leading company of healthcare software solutions, solving inefficiencies in the health system and demand for higher quality care by the fast‐pace rising middle‐class.
CLAS Healthcare is located at 4 Ton Dat Tien Street, Garden Plaza 2, District 7, Ho Chí Minh City, Vietnam.
CLAS Healthcare’s product/service offerings include the following:
- Engaging Patients: Bacsi24x7 Patient App, CHBase Patient Health Records (PHR), Bacsi24x7 Bot with Appointment, Bacsi24x7 Video Consultation (TBA after SFB SDK Application APIs are in production)
- Empowering Care Teams: Bacsi24x7 Doctor App, CME Knowlege Hub
- Optimizing Clinical/Operational Effectiveness: PK.Bacsi24x7 (Free HIS)
- Transforming Services: Patient App + Bot and Online Appointment + PHR+ Free HIS + other 3rd-party integrated services (MedCubes RemoteCase, Lifetrack PACS, Roche LIS)
Problem statement
CLAS Healthcare provides an app that connects hospitals, clinics and doctors to patients via a booking system. By marketing the app to the general public, they help hospitals, clinics and doctors gain increased visibility and acquire net new patients to visit their facilities. As a result, CLAS Healthcare has a lot of patient data through the app and also because of their integrations with medical facilities.
To help users discover these medical facilities and doctors, CLAS Healthcare employs a number of channels in acquiring new app users, including their website, app and over Facebook (as Facebook is very dominant in Vietnam). Over Facebook, they often advertise through a number of Facebook groups and pages. However, their Chief Marketing Officer, Ms Ha Nguyen, and her marketing team were having difficulty tracking the conversion rate from each of these different channels, and also from the Facebook groups. There was a lot of manual work involved in analysing data from Excel sheets. This made it hard to do any targeted marketing and also made it hard to plan marketing campaigns.
On the other hand, because medical facilities and doctors are often on a contract with CLAS, these doctors regularly want to know certain statistics to see whether their investment is paying off e.g. how much additional traffic CLAS’s app is giving them, how many patients have made bookings with them via CLAS’s app, patient demographic etc. Currently, their marketing team goes on a per-request basis for generating reports, where they have to manually do calculations and analysis in Excel, before sending the doctors a report containing the relevant information. Doctors are very busy as well and it is difficult to ask them for any information when doing data analysis. Ms Nguyen mentions that this was not a huge issue back when they had fewer doctors (around 10). However, they have scaled to over 50 doctors now, and doing manual reporting is proving to be very time consuming for the marketing team. Not being able to accurately track these metrics and quickly answer doctor’s questions could lead to some doctors terminating the contract. Also, there is a lack of a standardized way to show the doctors the results of using CLAS’s app.
Overall, the manual process in analysing information for marketing and reporting purposes has led to frustration and inefficiency for CLAS’s marketing team.
Solution, steps, and delivery
CLAS Healthcare saw an opportunity to make report generation and data analysis more efficient and self-sufficient through the use of interactive PowerBI charts. They wanted the report overview to be in almost real time, integrated into the front page of their main admin dashboard.
The marketing team has 3 important aspects that they need to track, which is:
- Doctors
- Patients
- Transactions (between users and doctors)
They then conduct market analysis by centering some key questions around these 3 aspects. Examples of questions include:
- How many hospitals/clinics are registered into the system for a specific week/month/year?
- How many patients are registered into the system for a specific week/month/year?
They would then like to generate 5 types of PowerBI reports based on these questions, being:
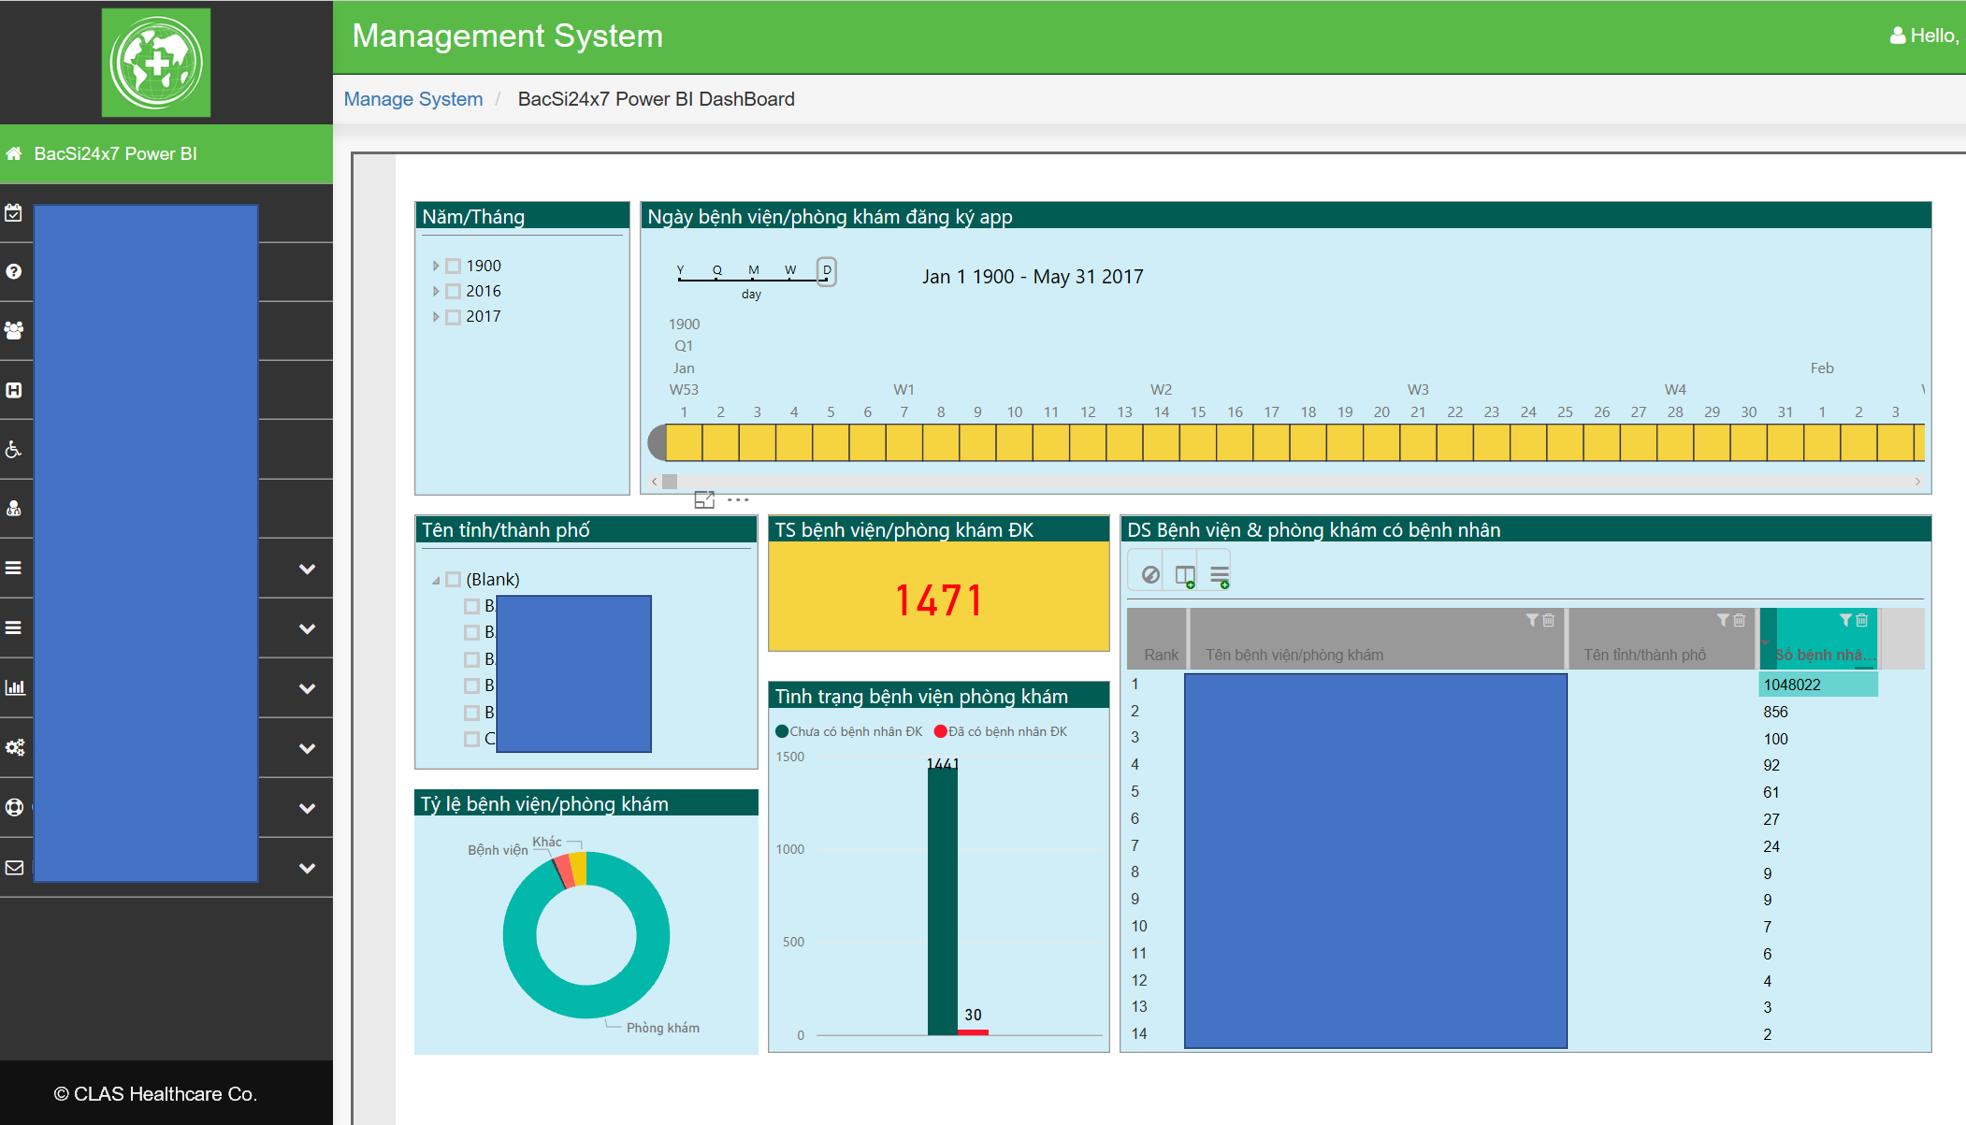
- Statistics on hospitals/clinics registered (e.g. the number of registered hospitals/clinics with the ability to view by duration, location, the proportion of hospitals vs clinics, filters based on the number of patients, etc.)
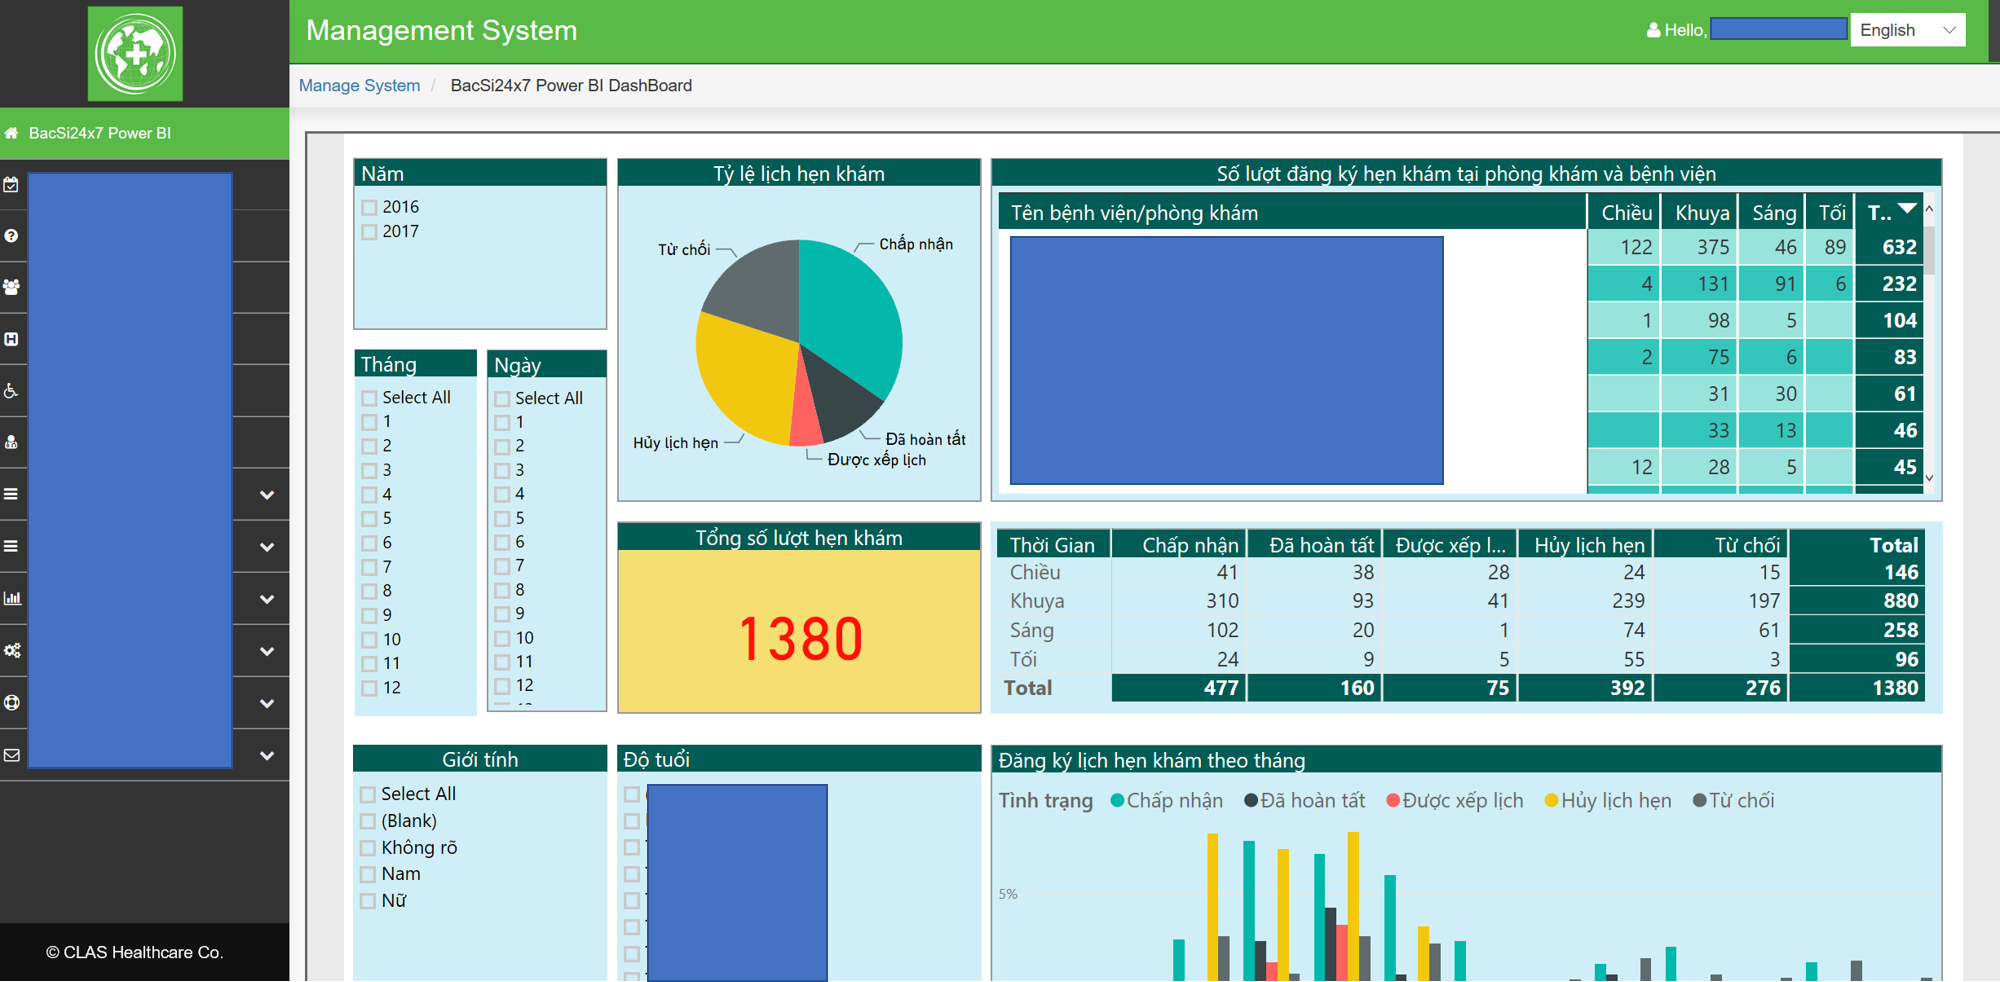
- Statistics on patients and bookings made (e.g. the total number of patients and bookings, detailed information about patients such as gender, age and location, detailed information about bookings such as proportion of morning and afternoon bookings, proportion of canceled and accepted bookings)
- Detailed information about registrations by patients (e.g. information about their bookings filtered by patient, time slot, which hospital/clinic bookings were made at)
- Detailed information about registrations by hospitals/clinics (e.g. filtered by hospital/clinic, time slot, specialist doctor, which device they registered on, proportion of activated vs not activated registrations)
- The result of hospital/clinic bookings (e.g. detailed information about the doctors who join and set up their booking schedules on the system, the status of bookings filtered by time slot, hospital/clinic, specialist doctor)
Technical Implementation
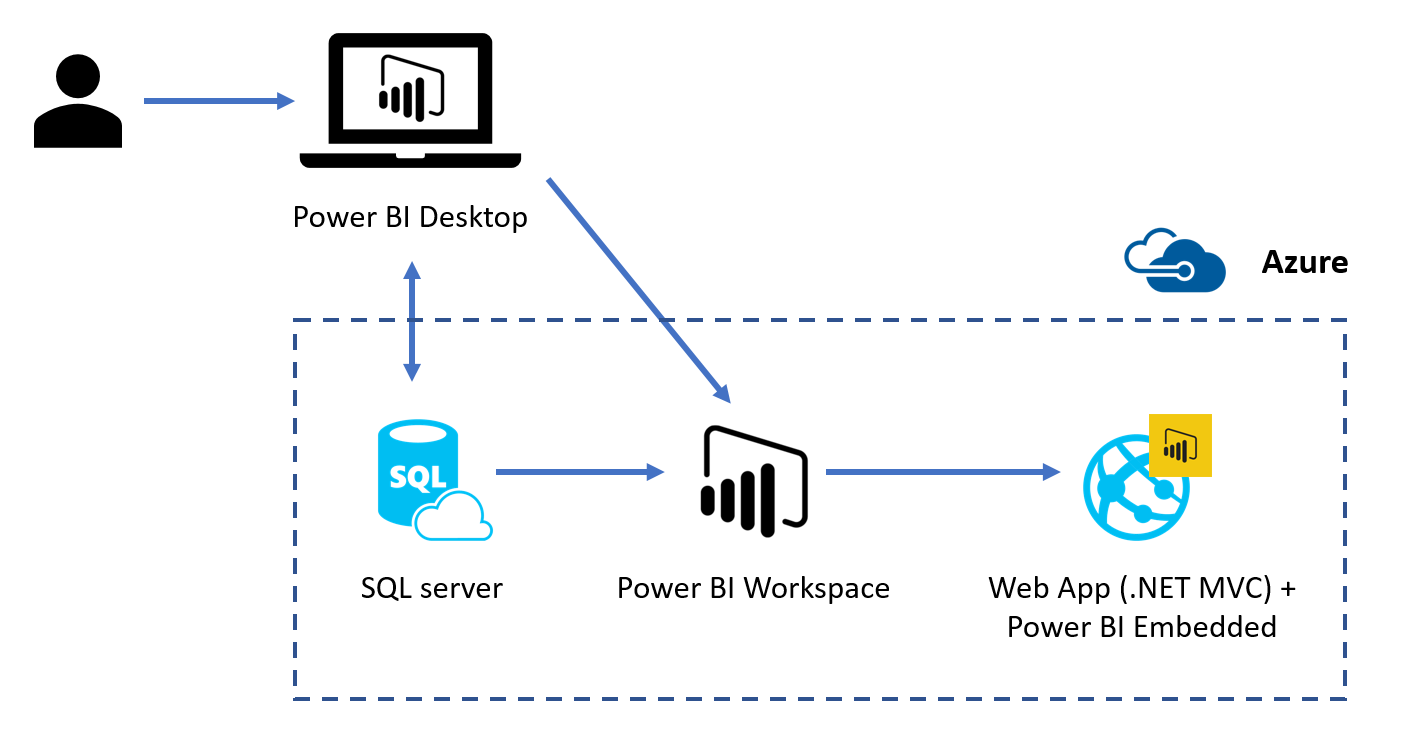
The overall architecture of the solution is as follows:
Data Import and Chart Creation
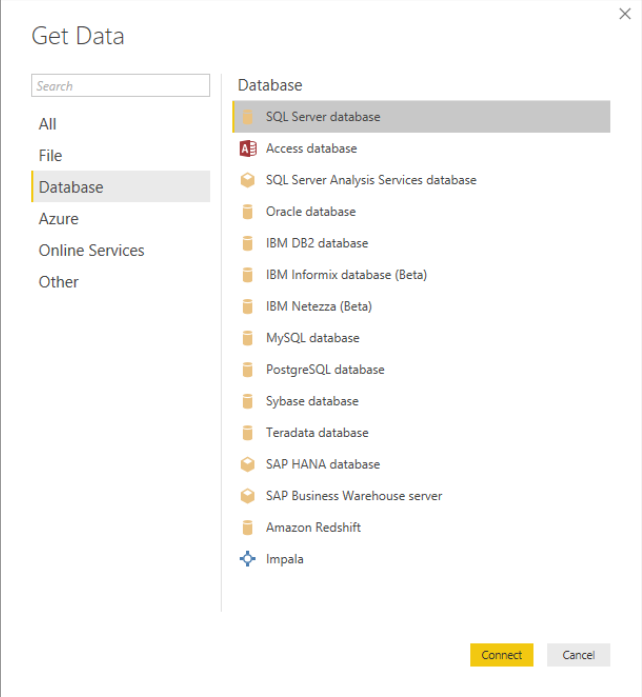
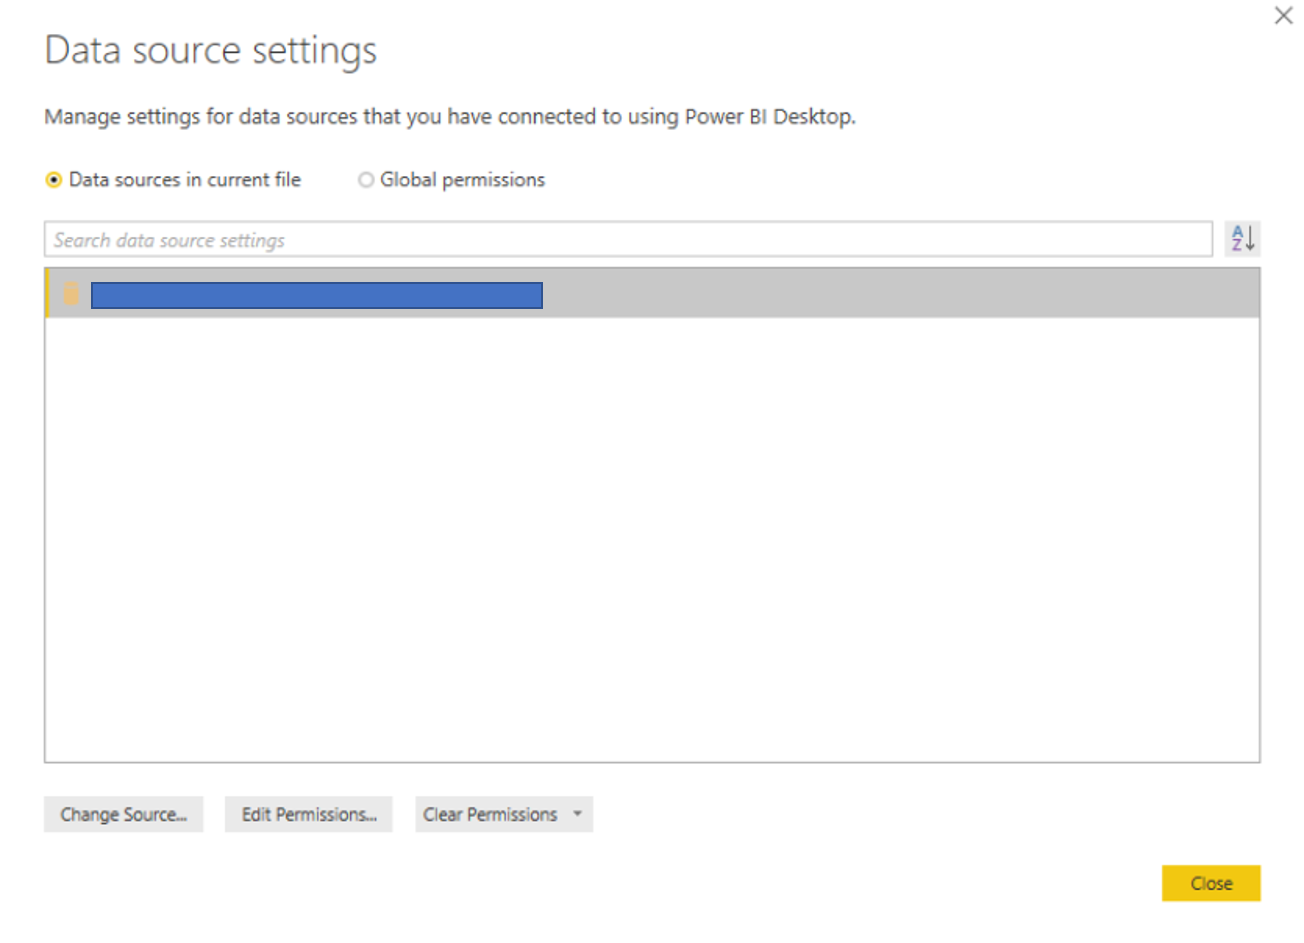
Data from the Azure SQL Server database was directly imported using the Power BI Desktop app. DirectQuery was used so that the dashboard would always have an almost realtime view of the data. The credentials to the SQL server db are entered and the data is loaded into Power BI to be used in charts.
The report was created from scratch using the Power BI Desktop UI tool, which was used to make the charts.
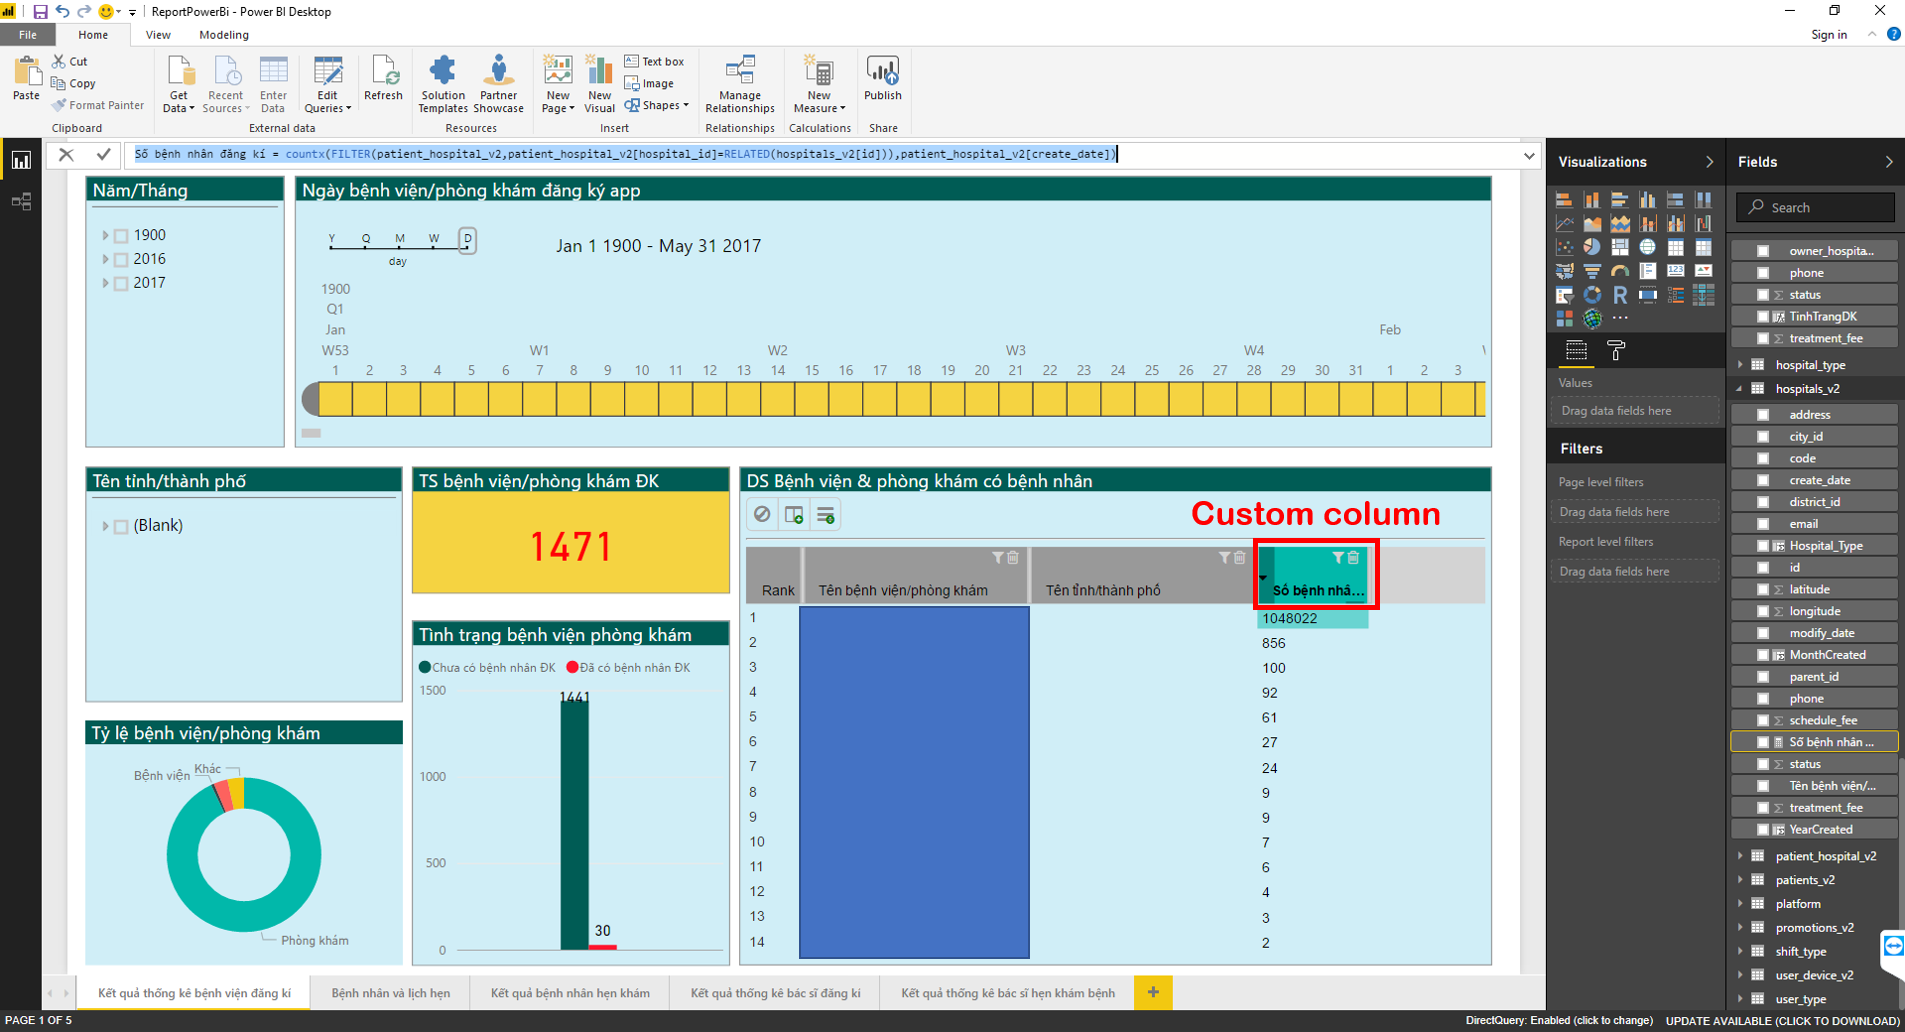
On the right hand side toolbar, visualizations were used to create different types of charts and fields are used to manage the data going into the charts. The types of visualizations used are as follows:
- Clustered column chart
- Card
- Slicer
- Pie chart
- Donut chart
- Custom visuals from the Power BI gallery
To support analysis reports, some additional columns and measures were needed to create certain charts. Under the top toolbar of the previous image, you can see an example of a DAX formula being used to generate the custom column. These were added using the following Data Analysis Expressions (DAX):
# Ty_le = [TS_Hen]/COUNTX(ALL(checkups_v2),checkups_v2[Thời gian hẹn])

# TinhTrangDK = if(doctors_v2[status]=0,"Chưa kích hoạt",if(doctors_v2[status]=1,"Đã kích hoạt","Khác"))

# Số bệnh nhân đăng kí = countx(FILTER(patient_hospital_v2,patient_hospital_v2[hospital_id]=RELATED(hospitals_v2[id])),patient_hospital_v2[create_date])
Integration with admin dashboard
Prerequisites: First, a Power BI workspace collection needs to be set up. This can be done using the Azure Portal, instructions here. Following this, a workspace has to be created inside the collection, and then a Power BI PBIX report needs to be imported into that workspace.
For our case, we used the PowerBI Embedded .NET SDK to import a PBIX file (generated from the report we created in Power BI Desktop), with the following code:
/// <summary>
/// Import file report
/// </summary>
/// <returns></returns>
public async Task<string> ImportReport(string fileName)
{
    var path = Server.MapPath("~/PowerBI/");
    using (var fileStream = FileSystem.File.OpenRead(path + fileName + ".pbix"))
    {
        using (var client = CreatePowerBiClient())
        {
            // Import PBIX file from the file stream
            var import = await client.Imports.PostImportWithFileAsync(_workspaceCollection, _workspaceId, fileStream, fileName);

            // Example of polling the import to check when the import has succeeded.
            while (import.ImportState != "Succeeded" && import.ImportState != "Failed")
            {
                import = await client.Imports.GetImportByIdAsync(_workspaceCollection, _workspaceId, import.Id);
            }

            return "Import report succeeded";
        }
    }
}
To embed the Power BI Report into the existing admin dashboard web app (.NET MVC), we use tokens to authorize reports. The following is the code for the controller to obtain the token to authorize and return the view with the dashboard:
[Authenticated]
[OutputCache(NoStore = true, Duration = 0, VaryByParam = "*")]
public class PowerReportController : BaseController
{
    private readonly string _accessKey;
    private readonly string _apiUrl;
    private readonly string _workspaceCollection;
    private readonly string _workspaceId;

    public PowerReportController()
    {
        // Obtain these values from web.config file for security reasons
        // Authentication and authorization is done using the access key and token
        _workspaceCollection = ConfigurationManager.AppSettings["powerbi:WorkspaceCollection"];
        _workspaceId = ConfigurationManager.AppSettings["powerbi:WorkspaceId"];
        _accessKey = ConfigurationManager.AppSettings["powerbi:AccessKey"];
        _apiUrl = ConfigurationManager.AppSettings["powerbi:ApiUrl"];
    }

    public ActionResult Index()
    {
        ViewBag.Menu = "powerBi";
        using (var client = CreatePowerBiClient())
        {
            // Use the workspace id to get the report
            var reportsResponse = client.Reports.GetReports(_workspaceCollection, _workspaceId);
            if (reportsResponse.Value.Count == 0)
            {

                var viewModelNon = new PowerBiReportViewModel
                {
                    Report = new Report(string.Empty, string.Empty, string.Empty, string.Empty),
                    AccessToken = string.Empty
                };
                return View(viewModelNon);
            }
            var report = reportsResponse.Value[0];

            var embedToken = PowerBIToken.CreateReportEmbedToken(_workspaceCollection, _workspaceId, report.Id);

            var dataset = client.Datasets.GetDatasets(_workspaceCollection, _workspaceId);
            var viewModel = new PowerBiReportViewModel
            {
                Report = report,
                AccessToken = embedToken.Generate(_accessKey) // access token generated for authorization
            };

            return View(viewModel);
        }
    }

    private IPowerBIClient CreatePowerBiClient()
    {
        var credentials = new TokenCredentials(_accessKey, "AppKey");
        var client = new PowerBIClient(credentials)
        {
            BaseUri = new Uri(_apiUrl)
        };

        return client;
    }
}
Lastly, the code in the view to display the Power BI Embedded dashboard (with authorization) is as follows:
<div class="main-content" id="content-report">
    @Html.PowerBIReportFor(m => m.Report, new { id = "pbi-report", style = "height:100vh; min-height:100vh", powerbi_access_token = Model.AccessToken })
</div>

@section scripts{
    <script src="~/Scripts/powerbi.js"></script>
    <script type="text/javascript">
      $(function () {
            var reportElement = document.getElementById('pbi-report');
            powerbi.embed(reportElement);
        });
    </script>
}
Below are screenshots of the first and second reports after they have been integrated into the admin dashboard:
Conclusion
CLAS Healthcare was pleased with the results of the Power BI integration with their admin dashboard, and Ms Nguyen said that it has allowed her to “spend less time in Excel, and more time working on the business”. She mentions that one of the key benefits that Power BI provides is the ability to create digital marketing strategies for the future based on current and past market trends.
The marketing team is now able to visualize and interact with their data in new ways to gain even more insights about trends as compared to doing manual analysis on Excel sheets. For instance, the reports show which of the Facebook groups are interested in which hospitals (e.g. a group for ladies seems to be generating a large number of conversions in a particular hospital). Using this, CLAS can plan targeted marketing campaigns in certain groups. The reports also show the location of where the audience is coming from, and CLAS can choose to refocus their marketing campaigns and relocate some of their staff.
When doctors ask for a report, the interactive dashboard allows for filtering down to that particular doctor, followed by sending a screenshot of the dashboard (as it is on the admin portal and has other sensitive information). If a doctor is unhappy with the results from using their system, CLAS is able to use the dashboards to make adjustments on their marketing plan. Sending a professional, standardized report to doctors on a regular basis is still preferred and is a consideration for the future.
“The number one benefit of Power BI is that it empowers business owners to make the right decisions at the right times. It helps them identify many business opportunities, find and resolve obstacles, and finally realize potential revenues.”
Ha Nguyen, Chief Marketing Officer, CLAS Healthcare
